The first half of this podcast is triggered by the story of Palantir, a company that promises a one-size-fits-all business analytics solution. Palantir's clients are not, apparently, satisfied.
The net: given a bunch of data, it takes area expertise to properly analyze and interpret.
Saturday, May 21, 2016
Tuesday, May 17, 2016
Replication, Pseudoreplication and Cell Culture
This is not an easy subject.
Here's an email thread from the other day between Rick Kahn, TJ Murphy and Nancy Bliwise. Since both TJ and Nancy direct courses at Emory for PhD students and undergraduates, respectively, Rick consulted each with his question.
I've injected a final thought at the end.
_________________
Rick: An issue arose at lab meeting yesterday when I suggested to a student that they include a second set of samples, same as the first, to provide a biological replicate. This is a control experiment demanded by a reviewer that is very unlikely to change the point of the paper, but of course that is not really the point here. You were quoted in our discussion as saying that it is not a biological replicate unless performed on a different day - which is pretty much in agreement with this article, which I like a lot but disagree on this point:
http://labstats.net/articles/cell_culture_n.html
Given that the cells are all "the same" or come from one vial or even separate vials all frozen down together, I see no value in adding extra days and it is impractical to obtain multiple aliquots of cell lines from different vendors for example. Certainly if doing rats or mice or human patients you gather from different animals. But the assumption in cell line experiments is that they are clonal and therefore supposed to be identical.
I think it is a discussion worth having and I am thinking of soliciting views across the GDBBS, for those who use cell culture in experiments. Thoughts?
TJ: A sample is comprised of replicates. Statistically, here are the two unbreakable rules on replicates within a sample:
1. Each replicate should be independent from every other replicate.
2. They should be randomized (in some way, shape, or form).
The problem with continuous cultured cells is that they are immortalized clones. Another problem is that it is hard to randomize culture wells to treatments given the need to be efficient with pipetting, etc.
Yes, you can argue that cultured cells are so similar from day to day that it seems absurd to consider a replicate taken on Monday as independent from one taken on Tuesday. I see that point.
It is harder to argue there is anything different at all between two replicates that are taken on the same day, side-by-side.
The day-to-day rule introduces a modicum of random chance into the design, given a system where the homogeneity is so heavily stacked against random chance.
Monday and Tuesday are more independent form each other more than are the left side and right sides of the bench on Monday.
Rick: I think we agree in principles here. As the article says it is incrementally better. But I would argue impractical or not worth the increase in terms of time and resources. I suspect if put to a vote of others my way is the overwhelmingly popular solution, though admittedly incrementally less independent.
TJ: I always made cell culture passage number the mark of independence. In my own system, a continuous primary cell culture line, there was good variation from passage to passage, much more so than within passage.
I think one of the big reasons we're in the unreliable research mess we're in is because when its been a choice between sound, unbiased statistical practice vs efficiency/cost, the latter wins too often. You may not like to hear that, it is surely an unpopular viewpoint for the go-go-go PI set, but I don't have any doubt that is what underlies the problem.
"I'm not cutting corners, I'm saving money."
The thumbs are on the scales in all kinds of ways in the name of efficiency.
It's like the culture of conducting unbiased scientific research has been replaced by a manufacturing culture. We should have a few beers just to hammer out the latter point.
Nancy: Rick, Do you know if the reviewer was requesting a biological replicate (e.g., lines from different animals) or a technical replicate to show that the procedure/phenomenon can be reproduced by others? While the article you provided suggests that replicating over different days or weeks, depending on what is appropriate for the experiment provides a purer technical replicate, I am not particularly convinced by that argument. I would argue that any replicate depends on the conditions/issues that you think need to be demonstrated. For example, if the experimental manipulation is highly technical and requires great skill, I would think a replication by different technicians/experimental staff would be important. If lab conditions are important, then different days/weeks might be meaningful. If it requires particular equipment calibrated carefully, then having another lab replicate it might be important. If the concern is just that this might be a fluke of a particular set of circumstances, then a single replication that shows the same phenomenon would be ok.
TJ was addressing independence and "n". It is possible to do a replicate on the same day/week and model the analysis to show that there were multiple cultures created nested within the original line. Doing the experiment on different days/week produces some independence but only if the lab conditions across days/weeks are relevant to the question.
TJ: I'd argue that statistical independence is only critical when doing significance testing. Not every experimental observation needs a significance test. For example, a central observation related to the main scientific argument should be designed for significance testing. Observations that are ancillary, adding only texture to the central argument, should be repeated to ensure reliability.
___________________
Let's distill this down to something of a more general take away.
We want to know either or all of three things about our data: Is the observation accurate? Are the findings precise? How reliable are the results?
It's up to the researcher to decide which of these is the most important objective of an experiment and then to go about collecting their information accordingly.
When accuracy is a key finding, replication has the effect of improving the estimate since standard error reduces with more replicates.
We standardize our techniques and analyze variance when precision is important.
When reliability of the observation is important, then the biggest threat are biases, both expected and unexpected. The device invented to deal with that problem is randomization.
Friday, May 6, 2016
Frauds, scams, cheats in science. What will it take to overcome it?
As I’ve gotten into my research project, I’ve begun to notice
the lack of accountability that presides within the scientific field. Research
projects typically have one or a few people working on them, and the temptation
to make data look better is high. As evidenced by the many papers retracted
each publishing cycle, there is major fraud going on within research, and I
think it stems from a lack of accountability and responsibility felt by those
carrying out fraudulent practices. It’s not a crazy thing to say, as well, that
none of us are completely immune to it. As Alex Chen enlighted us to the fraud
that occurred at Duke
University, it is perhaps too easy to manipulate data, or worse, invent
subjects and data that never even existed.
In 2015, New York University bioethicist Arthur
Caplan said, “The currency of science is fragile, and
allowing counterfeiters, fraudsters, bunko artists, scammers, and cheats to
continue to operate with abandon in the publishing realm is unacceptable.” Fraud
in science is on the rise, and not only is it a threat to those individuals’
careers, but it is a threat to all research. Science is designed to enlighten, provide
methods to answer sought out questions, and in the end to save lives, and when
fraud enters into the science, none of that can occur. Probably one of the main arguments for those
that have falsified data is the pressure to obtain funding and publish in a
funding environment that has become very strict over the past few years. What
they don’t see is how big of a threat fraudulent data is to public funding. The
public doesn’t like being lied to, especially when it has to do with potential
medical breakthroughs and their own health, and as fraud continues to come in
front of the public eye, funding will most likely decrease. Trust from the
public is necessary for funding, and maintaining honesty and integrity in
research is necessary for that trust.
An added complexity to this already complex mess of fraudulent
research is the idea that it might not be the wanted success and fame that
pushes them to be fraudulent, but it could be the necessity to put food on the
table for their family. Not only are
scientists striving to provide meaningful research to further medicine
(hopefully), but they are also striving to feed their families. Would having a
system in which accountability and responsibility were incumbent on the researchers
(by some type of education or university program) decrease the temptation to
falsify results? Would having a system in which the publish or perish mentality
was somehow alleviated, and there was security of an income, decrease the
temptation to falsify results? Would journals that began publishing negative,
nonsignificant results with repeated experiments from other papers help
decrease the temptation to falsify results? And can such a system exist, let
alone be put in place?
I believe it is necessary for the sustainability of
scientific research to report data correctly. This might only happen if there
is some sense of accountability and responsibility. Scientists are humans.
We need to eat. But we are expected, like most other humans are expected, to be
upright, have integrity, and not lie. Is there a way we can do good science,
remain upright, and eat?
Grad School Rankings...What do they mean??
In light of the recent post regarding ranking competitiveness of the UAE, I started turning over the idea of rankings in my head. We all value rankings, whether we admit it or not. For one, rankings help us make decisions. I'm sure a number of us peeked at the US News and World Report ranking biomedical research programs before selecting Emory as our home. From personal experience, I found one of the prime emphases in grant writing class to be citing the number of F31 grants awarded to Emory GDBBS students (apparently we are currently ranked program number 2 in the US, and at one point last year, we were in first place). Oddly enough, despite our high ranking in terms of NRSAs, we are only ranked number 30 in terms of biological science graduate programs, according to the US News and World Report website. How could this be? And what does statistics have to say about this?
Indeed, some rankings are based purely on objective, raw numbers, such as the NRSA statistic. The student either recieved F31 funding, or they did not. Others, such as the US News and World report rankings, and the UAE competitiveness rankings, are based on an amalgamation of a number of factors, including some that are subjective. I did a bit of digging to figure out what the US News and World Report numbers are based on. Perusing their website left me with more questions than answers. Any information given on how the rankings were determined is murky at best. The most data I could find on how they rank describes their methodology for their undergraduate ranking system (the original). As one article from their own website investigated this topic correctly points out, "The host of intangibles that makes up the [college] experience can't be measured by a series of data points." Factors such as reputation, selectivity and student retention are cited as some of the data points that determine ranking. In terms of quantification, however, I did not find any clear answer. The website cites a "Carnegie Classification" as the main method for determining rank.
As you can probably gather, the quantification involved in the Carnegie Classification is never really defined and left me wondering if there is some sort of conspiracy underlying these rankings. Reading about these rankings has left me feeling what I imagine a nonscientist feels like when they try to understand scientific data from reading pop culture articles. Still, we continue to value these rankings, even if we have no idea what they really mean. Yet again, we revisit the theme that there is a strong need, not only for statistical literacy, but for statistical transparency. Statistical analysis needs to be clearly laid out so that the layperson can fully appreciate the true value of a ranking.
I also wonder about how quantitative and qualitative factors that are apparently used in the Carnegie Classification are combined together to determine one final ranking value. As we have learned in class, continuous and categorical variables simply do not mix. Yet here and most everywhere, we see them being combined. Maybe it is beyond my level of statistical comprehension, but I wonder if there is a way to correctly combine the two?
 |
| How Emory Stacks Up...maybe. |
Indeed, some rankings are based purely on objective, raw numbers, such as the NRSA statistic. The student either recieved F31 funding, or they did not. Others, such as the US News and World report rankings, and the UAE competitiveness rankings, are based on an amalgamation of a number of factors, including some that are subjective. I did a bit of digging to figure out what the US News and World Report numbers are based on. Perusing their website left me with more questions than answers. Any information given on how the rankings were determined is murky at best. The most data I could find on how they rank describes their methodology for their undergraduate ranking system (the original). As one article from their own website investigated this topic correctly points out, "The host of intangibles that makes up the [college] experience can't be measured by a series of data points." Factors such as reputation, selectivity and student retention are cited as some of the data points that determine ranking. In terms of quantification, however, I did not find any clear answer. The website cites a "Carnegie Classification" as the main method for determining rank.
The Carnegie Classification was originally published in 1973, and subsequently updated in 1976, 1987, 1994, 2000, 2005, 2010, and 2015 to reflect changes among colleges and universities. This framework has been widely used in the study of higher education, both as a way to represent and control for institutional differences, and also in the design of research studies to ensure adequate representation of sampled institutions, students, or faculty.
As you can probably gather, the quantification involved in the Carnegie Classification is never really defined and left me wondering if there is some sort of conspiracy underlying these rankings. Reading about these rankings has left me feeling what I imagine a nonscientist feels like when they try to understand scientific data from reading pop culture articles. Still, we continue to value these rankings, even if we have no idea what they really mean. Yet again, we revisit the theme that there is a strong need, not only for statistical literacy, but for statistical transparency. Statistical analysis needs to be clearly laid out so that the layperson can fully appreciate the true value of a ranking.
I also wonder about how quantitative and qualitative factors that are apparently used in the Carnegie Classification are combined together to determine one final ranking value. As we have learned in class, continuous and categorical variables simply do not mix. Yet here and most everywhere, we see them being combined. Maybe it is beyond my level of statistical comprehension, but I wonder if there is a way to correctly combine the two?
How Do We Teach Statistics?
We use statistics as a buzzword to validate our statements and give weight to our claims. Unfortunately, we grow up with a healthy dose of skepticism - 76% of all statistics are made up, right?

Statistics should be the one quantity we believe to be valid and unbiased, but as cynical creatures we view them as a tool for manipulation rather than information. This issue is compounded by the complexity of correct statistics. The formulas and theories are difficult and not easily translated into a standard education. Additionally, there are so many factors that are involved in choosing the correct statistical approach to analyze the situation.
This leaves us with an important question. How do we teach statistics? Teachers need to first overcome the general dislike the field faces, then they must approach the problem of complexity and the variety of options for analyses.
General teaching theory hinges upon using building blocks to slowly introduce concepts to students and guide them towards understanding the more complicated lessons. This is great, but catching a graduate student and teaching them statistics feels like it is too late to start this process. We are capable of learning the complicated aspects (mostly) and we have a desire and a need to understand how statistics work for the benefit of our research and publish-ability. We aren’t the (main) issue when it comes to teaching statistics.
 What about the general population? They are the common enemy we face. As scientists, we communicate our results with statistics to assure people of the validity of our claims. Yet we face the general skepticism and dislike that people associate with things they do not understand. The press misrepresents our studies in worms as the new cures for cancer, and the public is disappointed with “how little” we have really done. Our funding is never sufficient, and our esoteric communication methods do not aid our cause. We cannot expect the general population to gain an in depth grasp of our science, but we should fight for them to look to science as a credible source. One method for this is to instill a basic understanding of statistics. A real understanding and trust, not skepticism and bare grasping of the subject.
I started thinking about this when I came upon this book called The Cartoon Introduction to Statistics. Preview pages and descriptions of the book show a method in which statistics can be communicated without being misrepresented. The book seems to build on basics with a “Math Cave” containing more complex equations and concepts. This seems like an excellent marriage between simplifying a complex topic for a general audience while still providing depth and breadth of knowledge to help people understand a necessary field.

There is no reason that we shouldn’t all have a basic understanding of statistics. The question of “How do we teach statistics” encompasses more than just the teaching method, but also the timing and the reach of how we teach it. Statistics should be a subject covered as one of the essentials of our mathematical education. This small step will aid the reach and understanding of science, and help reinforce the effect of good statistical analysis for making an argument.
Thursday, May 5, 2016
Correlation Does Not Imply Causation... But Wouldn't it Be Funny if it Did?
Does correlation imply causation? I think everyone and their grandmother at this point know that this is not the case. The assumption that correlation proves causation is incorrect logic -- just because two events occur together does not mean that they have a cause-and-effect relationship. There's even a name for this type of logical fallacy: "cum hoc ergo propter hoc," which is later for "with this, therefore because of this." However, allowing correlation to imply causation is just so so tempting. Scientifically, we correct for this by randomizing subjects and, ideally, being blinded until data analysis is complete.
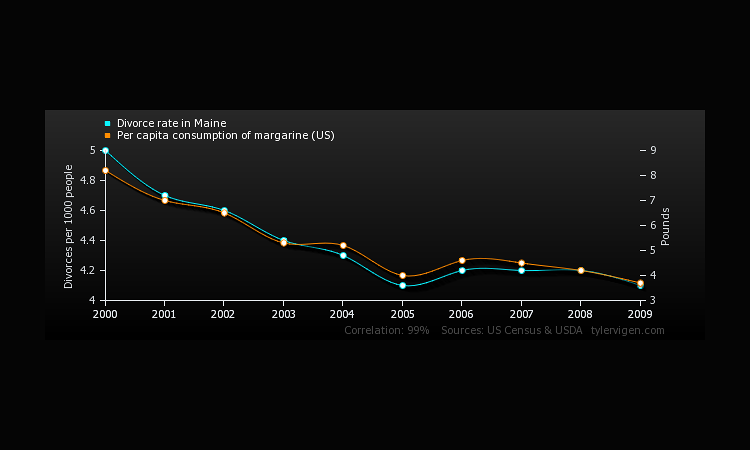
Yet, if we were to conclude that correlation does indeed imply cause causation, how fun and interesting would the world be? We could blame the per capita consumption of margarine in the US for the falling divorce rate in Maine -- the two correlate to 99% according to the US Census and USDA.
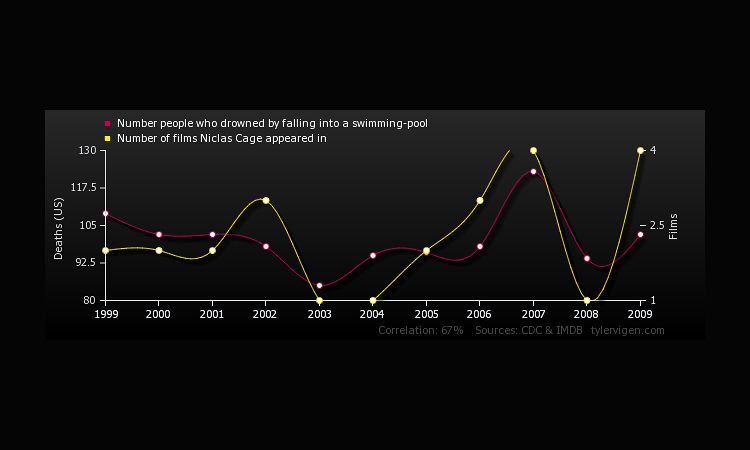
Furthermore (with what I believe to be a 100% valid correlation) we could lower the number of people who drown by falling into a swimming pool in a very simple manner -- stop allowing Nicolas Cage to appear in films!
There would be some "innocent" (OR ARE THEY?!) victims though -- skiing facility revenue may decrease as people realize that funding these establishments directly correlated to a larger amount of people dying due to being tangled in their bed sheets.

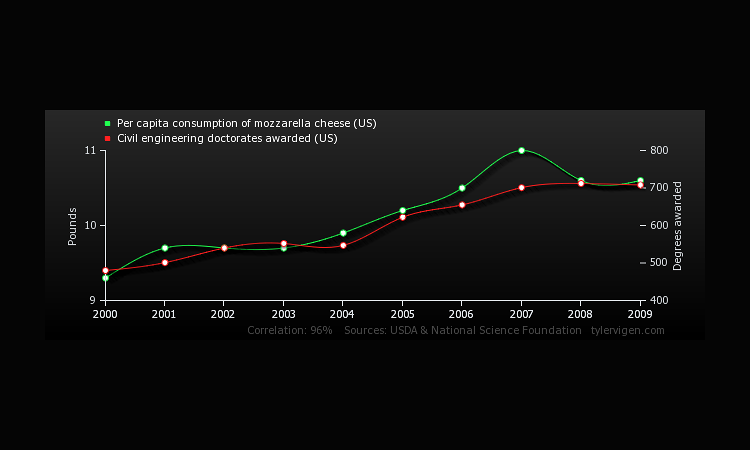
And to think -- I could even validate my own consumption of mozzarella cheese! "There are simply so many Civil Engineering doctorates being awarded these days," I could tell myself. "I have no choice but to consume this cheese!"
Hans and Ola Rosling: How not to be ignorant about the world
This blog post deviates from the
topics learned in our biostatistics course, given it focuses on how we can use
statistics to get a point across. Since Dr. Murphy gave great importance to bias
and I have an interest on public health, I found this TED talk about reducing
bias in our knowledge of global population and global health interesting. Hans
and Ola Rosling use statistics to prove to the audience that they have a high
statistical chance of being wrong about what they think they know about the
world. I believe it was an interesting use of statistics, because, as we have
mentioned in class, people pay more attention when they are presented
statistics (even if these statistics are wrong), so it was smart of them to use
this method to get their point across!
The main
point of their talk is to improve the knowledge people have about what is going
on in the world because, as Hans states, “the best way to think about the
future is to know the present”. However, this is sometimes hard because of
three skewed sources of information, which they recognize as:
1.
Personal bias: the different experiences each
person has, depending on where they live and the people they are surrounded by
2.
Outdated information: what teachers teach in
school is usually an outdated world view
3.
News bias, which is always exaggerated
Hans then adds intuition to this equation. He states that we
seek causality where there is none and then get an illusion of confidence
(which, as mentioned in class, can happen to many researchers). In order to combat
it, he says that first we need to measure this false sense of confidence, in
order to then be able to cure it. This way, we will be able to turn our
intuition into strength again.
Hans’ son,
Ola, then states four misconceptions people have about the world and then
demonstrates the counterpart of each misconception, or how people should be
thinking. The four misconceptions and their counterparts (shown after the arrow
[à]) are the following:
1.
Everything gets worse à most things improve
2.
There are rich and poor à most people are in the middle
3.
First, countries have to be rich in order to get
the personal development à
first a country had to work on their social aspects, then they will get rich
4.
Sharks are dangerous (meaning: if you are scared
of something, you are going to exaggerate) à
sharks kill very few
Ola believes that if people change their point of view about
the world by looking at the facts, they might be able to understand what is
coming in the future.
Wednesday, May 4, 2016
What doesn't kill me only ...... gives my doctor the opportunity to finish the job?
A recent article published in the British Medical Journal looked into the number of deaths due to medical errors. They found that about a quarter million deaths a year are due to medical errors. That would make medical error deaths more prominent than deaths due to diseases such as chronic lung disease and third to Heart Disease and Cancer.

This is a very curious and scary statistic. In a way it is a great statistic because it brings up an issue that as far as I know has not been well studied and quantified. It also bring to light the different mechanisms of avoiding errors in the hospital. In other words the statistic really is asking: Do the regulatory mechanisms in place actually work? This might also be a good statistic for insurance companies and give them a reason to increase their rates. Of course in general this is a bad piece of information for any of the living and especially those of us planning long hospital stays in the near future. I think this article is a good example of science and statistics influencing the general public. It is a very easy to digest statistic. It is something that everyone can understand and is very understandable due to the common knowledge of the other diseases it is being related to. Hopefully this awareness will translate into reform that decreases these horrible deaths every year.
This is a very curious and scary statistic. In a way it is a great statistic because it brings up an issue that as far as I know has not been well studied and quantified. It also bring to light the different mechanisms of avoiding errors in the hospital. In other words the statistic really is asking: Do the regulatory mechanisms in place actually work? This might also be a good statistic for insurance companies and give them a reason to increase their rates. Of course in general this is a bad piece of information for any of the living and especially those of us planning long hospital stays in the near future. I think this article is a good example of science and statistics influencing the general public. It is a very easy to digest statistic. It is something that everyone can understand and is very understandable due to the common knowledge of the other diseases it is being related to. Hopefully this awareness will translate into reform that decreases these horrible deaths every year.
Welcome to Trump Tower....... Umm I mean the White House?
This is a counter point to the recent blog post discussing the chance of Bernie Sanders winning the White House. In this article, a statistician predicts that Donald Trump will win the election in November. Similar to the blog below, this person has never been wrong. Well, it finally happened everyone. All of the other potential candidates dropped out and now the Trumpster (hybrid of Trump and dumpster) himself is the nominee for the Republican party. All of the odds stacked against him including not really being qualified for the position in the first place.

Multiple Comparisons: How do we compare in Non-Parametric Data?
With my last post about nonparametric tests that are the
equivalent to ANOVA tests, and focusing primarily on the Kruskal-Wallis Test, I
next wanted to write a blog post about what sort of post-hoc analysis are
available to us for these experiments with nonparametric data sets.
For the
most part, there seems to be little consensus among statisticians regarding
what sort of comparison tests to perform post hoc on nonparametric data sets.
The best answer I’ve been able to find that specifically states something to
the effect of “When you wish to run a post hoc test on nonparametric data, you
can use any of these tests…” provides three options. Those three are the Mann
Whitney U test, the Nemenyi test, and a modified Bonferroni Dunn correction.
First,
let’s discuss the Mann Whitney U test. As previous described in my Kruskal
Wallis post, the Mann Whitney U test is used to compare differences between two
independent groups that have an ordinal or continuous dependent variable, but
are not normally distributed. A simplified way to think about the Mann Whitney
U test is to consider it to be the nonparametric equivalent to the independent
t test (but this isn’t always the case). However, the Mann Whitney test
provides us the opportunity to draw varying conclusions about our nonparametric
data depending on what we assume about our data’s distribution, which is unlike
the independent t test. These conclusions from the Mann Whitney test can range
from stating whether two populations differ at all, to providing a difference
in group medians. The four assumptions we can make using the Mann Whitney U
test are:
1.
Your dependent variable is ordinal or continuous
2.
Your independent variable should be two
categorical groups that are independent of each other.
3.
Your observations should be independent of each
other.
4.
Your two independent variables are not normally
distributed.
The only problem with the Mann Whitney U test is that while
it provides a lower type II error, there is also the risk of potentially high
type I error.
The Nemenyi test is a bit more
simplified. This is a post hoc test intended to find groups within a
nonparametric data set that differ after a statistical test of multiple
comparisons has successfully rejected the null hypothesis. This null hypothesis
would be that the comparisons show data groups to be similar. This is,
unfortunately, as much as I could find and make sense of regarding this test,
but I’d love to hear about anything anyone else uncovers about this test. This
test is a “middle road” of these three options with a moderate type I and type
II error risks.
Finally, the Bonferroni adjustment
is exactly what you’d expect it to be. In a past blog about multiple
comparisons, I discussed exactly what the Bonferroni correction is. Without too
much detail, this test is essentially used to perform multiple comparisons
without sacrificing your type I error by dividing your threshold for alpha by
the total number of comparisons you’d like to make. Using this correction means
the alpha for each comparison is very small to conserve the set type I error
threshold for the entire comparison set. Unfortunately, the Bonferroni
correction is still very conservative of type I errors at the expense of
statistical power.
Multiple Comparisons : Kruskal Wallis Test
Keeping with the theme of my last
three blog posts, I wanted to continue on with the idea of explaining multiple
comparison tests that are available to us for statistical analysis. This post will focus on the Kruskal WallisTest. Emily Summerbell also posted a great entry (HERE) about this same test and walks through how to perform this test on Prism, but I want to focus more on understanding the why of it, rather than an example.
The KruskalWallis H test is otherwise referred to as the One way ANOVA test on assigned
ranks. It is simply a test that can be used determine whether a significant
difference exists between two or more groups of an independent variable on a
continuous or ordinal dependent variable set, and analyzes rank based,
nonparametric data sets. As mentioned,
the Kruskal Wallis test is the ANOVA alternative for nonparametric data sets
and is an additional extension of another statistical test we’ve encountered in
this class, the Mann Whitney U test.
As a quick
refresher for those that have forgotten, the Mann Whitney U test (also called
the Mann Whitney Wilcoxon test, or the Wilcoxon rank sum test) is a
nonparametric test of the null hypothesis that is used to determine if two
samples came from the same population, and/or that the value from one
particular population may tend towards a larger value than the other. In
comparison to the Student’s T test, Mann Whitney tests are not under the
assumption of a normal distribution of the populations, but still functions
with similar efficiency. The one difference between the Mann Whitney test and
the Student’s T test is that the Mann Whitney test has a reduced ability to
indicate significance because of outliers.
A few assumptions
that come with the Kruskal Wallis test are:
1.
Your dependent variable should be ordinal or
continuous
2.
Your independent variable should consist of two
or more categorical groups that are independent of each other.
3.
All of your observations should be independent
of each other.
4.
The shape of your population distributions needs
to be determined in order to know what your Kruskal Wallis test will compare.
If the distributions for your independent sets are of the same shape, you
compare medians of the dependent variable; if they are of different shapes then
you compare means.
One important key feature of the Kruskal Wallis H test is
that is not a post hoc analysis test, and that it does not tell you which
specific groups in your independent variable set are statistically
significantly different, but rather it tells you that there are at least two
groups of your independent variable that are different.
As a quick
side-note, there is a repeated measures equivalent for nonparametric data,
called the Friedman’s test.
Subscribe to:
Posts (Atom)