
The topic of "Introducing Statistics" made me think of a very exciting opportunity I had the chance to be a part of this semester. Since January, I have been involved in my first teaching assistanceship at Emory University. I am an instructor of a hypothesis-driven introductory laboratory course for undergraduates. While many of the students are familiar with many of the basic lab techniques - pipetting, sterile procedure, plating bacteria - this was the first time that they were exposed to one of the classic statistical tests: chi-squared. And now, I was the person to introduce this crucial facet of statistics to them - talk about an important first introduction.
The lab period was designed to ease the students into using the test. We used a particularly good module from Math Bench as our learning tool, which explains the roles of observed and expected values in the calculation, the relevance of degrees of freedom, the importance of p-values, and how to determine significance from their results.
I enjoyed guiding them through the process and answering their questions - the biostatistics course served me well.
Once our initial foray into the realm of statistics was over, I was pleased to find that many of the students took to the lesson quite well. Several engaged me in a more detailed discussion of degrees of freedom during the next class, and all were eager for advice on how best to incorporate statistics into their final projects.
Unfortunately, it was during the revision process of these final projects that I truly had the chance to see what lessons my students had taken to heart. The situation I found myself in is illustrated perfectly by this poignant (if lengthy) comic by Randall Munroe, the brilliant scientific cartoonist behind the webcomic xkcd.
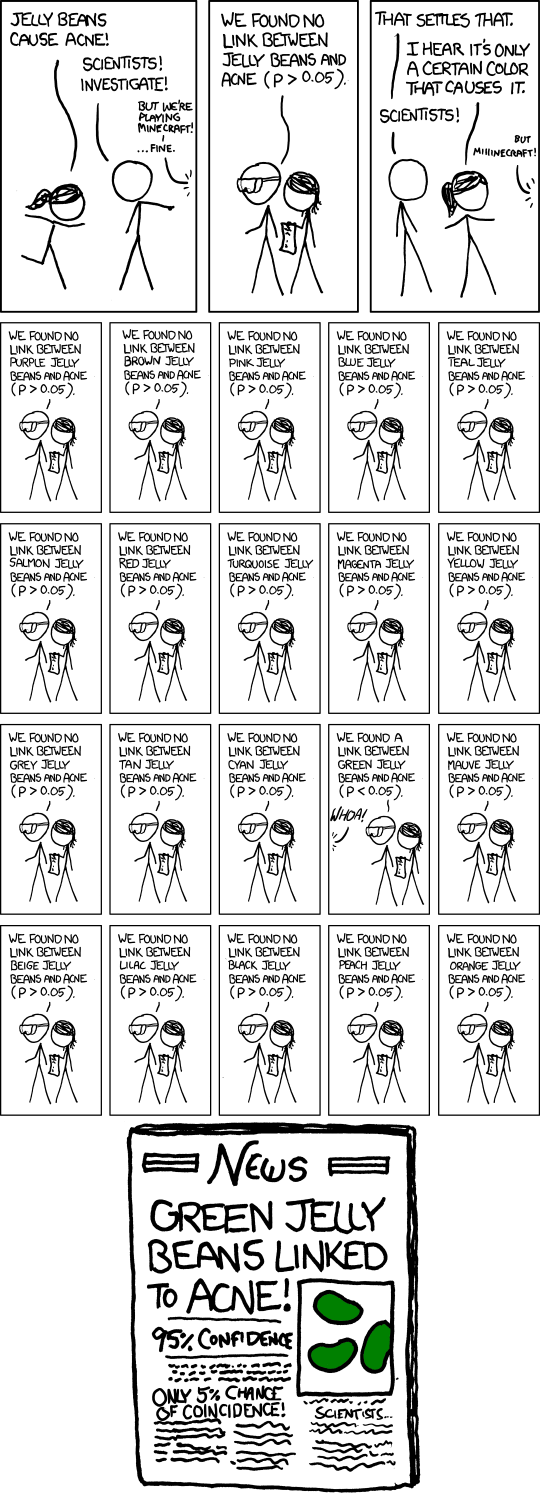
Here, my students play the role of both the excited news journalist and the beleaguered scientists, diligently carrying out their experiments until the moment they are free to jump to disproportionate conclusions. While my students know how to use the chi-squared test, they lack a deeper understanding of its applications, and are prone to taking its output as gospel. Any significance they find, no matter how slim, is certainly newsworthy, and sufficient to state that they have answered all the remaining research questions in the field of biology.
Upon reading their extravagant claims in their final projects, I was surprised. But upon reflection, it got me thinking about how I, as a student in statistics, would be seen in their position.
Just like my undergraduate students, I am prone to behaving like a child with a shiny new toy. Granted, my toys - paired t-tests, two-way ANOVA - might be a bit more complex than the ones they are working with, and might require a little more know-how and assembly to get them up and running. Nonetheless, here at the beginning stages of my statistical understanding, I find myself tending to default to trusting the output of a test run in Prism, even if I am not completely clear on what exactly that output means.
In this way, I am no better off than a reporter excited about jelly beans.
While I might be the instructor, the absolute confidence of my students in their chi-squared results opened my eyes to a very important lesson. It is never enough to simply trust in the power of statistics, as awesome as that power may be. Without a complete understanding of the tests you are using, you are destined to abuse them.
