I did not
pick up this paper in the hopes of using as a BadStats example, which makes the
improper statistics all the more disappointing. The behavioral output used by Gaskin et al. (2010) was an investigation ratio (IR) between exploration times
of repeated and novel objects. This metric made their abuse of statistical
design personal, because I use the exact same behavioral output in my
experiments. The premise of the study was sound, and was developed in response
to an earlier, poorly designed study. Albasser et al. (2009) claimed to find a relationship between the amount of time
a rat explores an object and later object memory. These results were pooled
from subjects in different experimental conditions, and therefore the
correlation they ran encompassed multiple independent variables. Gaskin et al.
(2010) strove to experimentally test the relationship between exploration
duration and memory strength.
The
experimental setup was fairly sound. In total, the team performed 4 experiments
to assess any correlation between exploration and memory, and then manipulated
exploration time to determine if a causal role existed. Problems came in most
notably in experiments 3 and 4, in which the authors compared the memory of control
and dorsal hippocampus-lesioned rats from a novel object preference task.
Importantly, the only difference between experiments 3 and 4 were the retention
intervals between the study session (in which rats viewed two identical copies
of an object) and the multiple test sessions (in which rats viewed a copy of
the object from the study phase and a novel object). Experiment 3 used a 2-hour
delay for the first test, then 24 hour intervals for the next 4 days, and
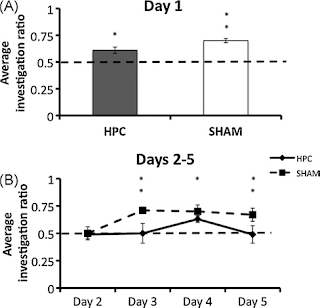
experiment 4 separated all tests by 35 seconds. Not surprisingly, the data from
the two experiments were presented in identical fashion:
Really
the only way to tell which is which is the labelling of Days (experiment 3)
versus Tests (experiment 4). Even with the identical design, their analyses
smack of p-hacking. To their credit, they are fully transparent about it.
In
experiment 3, analyses of IRs included:
1)
One-sample t-tests for
both groups at every time point to determine if IRs were above chance (0.5) –
found significant differences
2)
Independent sample
t-tests to compare IRs between control and lesioned groups at every time point
– found significant differences
3)
One-way RM ANOVA (test
days as repeated measure) run separately for control and lesion groups – they
did report a significant F-value in the control group, but claim it “was only
due to a significant difference between the IRs obtained during Days 2 and 3”,
and therefore dismiss it
Alright.
Got that? Here were the analyses for
experiment 4:
1)
One-sample t-tests for
both groups at every time point to determine if IRs were above chance (0.5) –
found significant differences
2)
Independent sample
t-tests to compare IRs between control and lesioned groups at the first time
point – found significant differences
3)
One-way RM ANOVA on
both groups – showing no effect of test session on either group.
4)
Two-way mixed ANOVA by
group and test session – found a trend toward group effect and a significant
effect of test session.
a.
Post hoc comparisons
of IRs between groups – found significant differences
By the
end, I was confused. Why run a two-way
ANOVA in experiment 4 and not 3? Why also run a one-way ANOVA in experiment
4? Why run separate one-way ANOVAs on
the two groups that end up being compared by t-tests? Why run independent
t-tests and an ANOVA for the same data in experiment 3?
The
authors set up the paper by saying that differences in IR between groups are
not behaviorally relevant - only differences from chance. That being the case, the independent sample
t-tests are improper. A mixed factor two-way ANOVA does address changes over
time and differences between groups, and their use of a two-way ANOVA in
experiment 4 was correct. Adding on
one-way ANOVAs to the same data, however, was not.
There is
no report of the raw data, so I cannot reevaluate their results. However, the varied analyses and redundant
tests (with varied appropriateness) make me feel like I was sitting in on a
graduate student running every test they could think of to drive that p-value
down. I commend the authors for
reporting them all, but transparency does not make biased, exploratory analyses
good practice.
References


No comments:
Post a Comment