 Moving on, in Figure 3C they actually do multiple comparisons, but it is likely they did a series of t-tests, rather than the more appropriate one-way ANOVA. Additionally, they say that their third condition is statistically significantly different from the siRNA conditions, but they do not indicate if they are pooling all siRNA conditions, or just comparing to siRNA -1. As a reader, I am left with several questions. Why are you only showing CCL1 treatment with siRNA-1? Figure 1 indicates that siRNA-2 should be equally as effective. Can we really trust these p-values?
Long non‑coding RNA‑GAS5 acts as a tumor suppressor in bladder transitional cell carcinoma via regulation of chemokine (C‑C motif) ligand 1 expression

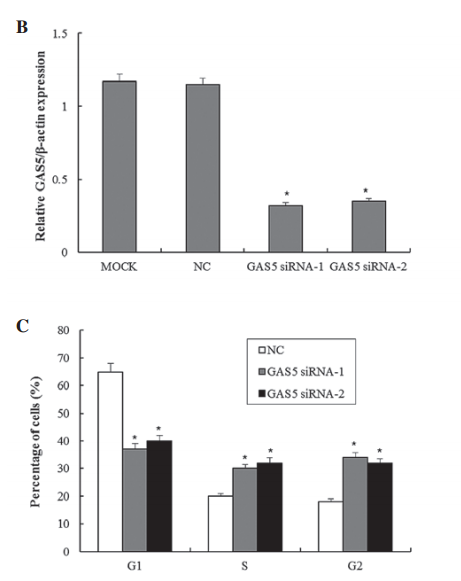
The authors examined the link between the long non-coding RNA Gas5 and tumor suppression in bladder cancer cells as compared to normal cells. They use always show significance in each figure with p-values <0.05, however not once do they describe which statistical test they used. Their wording indicates they are doing some kind of t-test comparing an experimental cell treatment back to control cells. In some figures, such as 1C, this is acceptable. However, in figures such as 1B, it should be a one-way ANOVA for multiple comparisons to ensure that the siRNA treatments are different from both the mock transfection and the negative control - otherwise what is the point of a negative control?
We would like to trust the integrity of our colleagues, however if we have no indication of validity of data or the methods they used, how can we use their data to guide our own learning and research? We need a good reason to trust the conclusions drawn, and that starts y using the correct statistical models and tests for the conclusions you are drawing.
C. Qifeng et. al. Long non‑coding RNA‑GAS5 acts as a tumor suppressor in bladder transitional cell carcinoma via regulation of chemokine (C‑C motif) ligand 1 expression. Molecular Medicine Reports 13: 27-34, 2016.
While in this class, I have come to realize that it seems that when scientists don't know what statistical test to do, they end up just performing some form of t tests; the same that the researchers of this paper did. Scientists nowadays know that they need to show some kind of statistics in order for their paper to be accepted and as a result, they default to a t test, no matter what their data looks like.
ReplyDeleteIn addition, it's weird that many researchers give p values and just expect you to accept this at face value without giving any indication of how they arrived at this value. How do they expect us to see the true value of their results if they don't reveal all steps involved in obtaining this value?