Continuous variables are defined as variables that can take
on any value between a minimum and maximum value. Time, distance, and height are common examples
of continuous variables. In contrast, categorical variables can be obtained by counting or used to describe something categorical in nature,
such as gender.
I’ve encountered my share of confounds when attempting to
distinguish changes in a continuous variables. In one case, I was quantifying fluorescent intensity in ImageJ, where intensity is a continuous variable. When
there is a large difference between the flourescent intensity of the two groups
that I am trying to distinguish, it is easy to see differences on a graph of the raw values. However, when attempting to
distinguish intensity differences that are very subtle, (as biological
differences often are), the raw values of intensity can be difficult to
appreciate. That is, it is difficult to
convince myself and others that the change in flourescent intensity is biologically relevant. Thresholding,
or turning continuous variables into discrete
categories, seems to be a popular choice for addressing this problem. But where do we set a threshold such that it
can maximally distinguish between multiple groups? This is an issue we must consider, particularly
for data without established positive controls.
 |
| Categorical positive control??! |
This become more complex when we consider elimination of bias.
Is it possible to transform a continuous variable into a categorical variable
in an unbiased fashion? How do we set a protocol
for defining categories for continuous variables in a way that we are not
biasing ourselves towards a particular conclusion?
We transform continuous variables into categorical variables
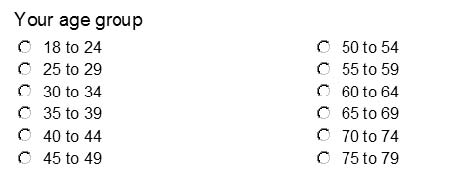
all the time. One example that comes to
mind are online surveys that categorize responders by age. I always wonder about the rationale for choosing these threshold cutoffs.
 |
| Well reasoned or....random? |
You pose an interesting question here: "Is it possible to transform a continuous variable into a categorical variable in an unbiased fashion?" I have recently had some experience with this scenario in my own research. I was beginning to conduct experiments in which I used a chemically-induced colitis mouse model to produce intestinal damage and inflammation. The outcome measure that every paper reports for this kind of experiment is the daily disease activity index, which is calculated as the average of scores for weight loss, feces consistency, and occult blood, all scales running from 0-4. That much I could get from the literature, but very few authors publish their scoring scale and criteria, so I had to make that up for myself. Incidentally, this is exactly the sort of qualitative-to-quantitative data presentation that Dr. Murphy railed against early in this class. I still consider it a perfectly valid data format; it just requires the development of a scoring system that is objective and biologically relevant. Feces consistency and the presence of fecal blood are not properties that can be easily measured quantitatively every day, so it made sense to design a scale system for those observations. I also found ways to make the scoring of these as objective as possible to minimize bias. The weight scale was trickier, though, because, as you say, you have to determine thresholds that are meaningful. I did this by collecting a lot of preliminary data. I ran tests of the colitis experiment and measured how much weight mice lost and correlated it with other indicators of disease activity such as the feces measurements. I also tracked weight fluctuation in untreated mice to get an idea of how much could be considered “normal” variability. Then I set my weight loss scale thresholds so that anything within the standard deviation of controls’ weight loss was a “zero”, the first positive weight score normally fell on the same day that other disease indicators were positive, and higher score thresholds reflected losses that would have a functional biological impact. In the end, I can’t say my scale is a perfect representation of disease progression, but it does convey the most meaningful information and ignores insignificant variation. I can’t say I’ve heard of converting fluorescence measurements to a scale like this, and if the motivation for doing so is to make the differences between samples seem greater than they are, that seems risky to me. If you’re going to use a scale, though, I think the best practice is to validate it – figure out what kind of normal variation there is, maybe within a single sample or related samples, and set your scale to zero that out. You could do a gene knockdown, quantify the degree of knockdown using a different method like western blot, then image and use the change observed there to set your scale to better reflect biologically-relevant differences.
ReplyDeleteAs an aside I also think it is interesting to note that even age is categorically expressed. You rightfully note that it is a continuous variable and yet we round our ages to years. Rarely have I ever seen it defined in papers that use age as data; perhaps they round to the nearest year (1 year if the patient is less than 1.5 years old and 2 years if they are greater than or equal to 1.5 years) or perhaps it is always rounded down until your next birthday (1 year until the patient turns 2 years old even if their 2nd birthday is one day away). For children, especially during early development, this kind of a difference can be crucial when determining if the child is meeting developmental milestones. A 2 year old has lived 33.33% longer than a 1.5 year old whereas a 40 year old has only lived 1.27% than a 39.5 year old. This is why for early development patient ages are measured in months. Hence the categorization thresholds have been chosen through the use of using a smaller unit of measure. Yet here we still run into the same issue of how we define months old. Thus we can extrapolate that almost all forms of measurement can be subject to categorization. Furthermore we are limited by the precision of our tools of measurement. We may think we are giving mouse 1 mL of drug x, when in reality we are giving it 1.030534… mL. Yet if we were able to measure data with perfect precision our statistical methods would not be manageable in the context of infinite significant figures. Thus it can be argued that all of statistics rely on some level of categorization, even of continuous variables. Thus our thresholds must be chosen in such a way as for us to learn the desire information for our tests, not unlike our reasons for choosing particular units of measure.
ReplyDelete